Automation Analytics
Basic analytics
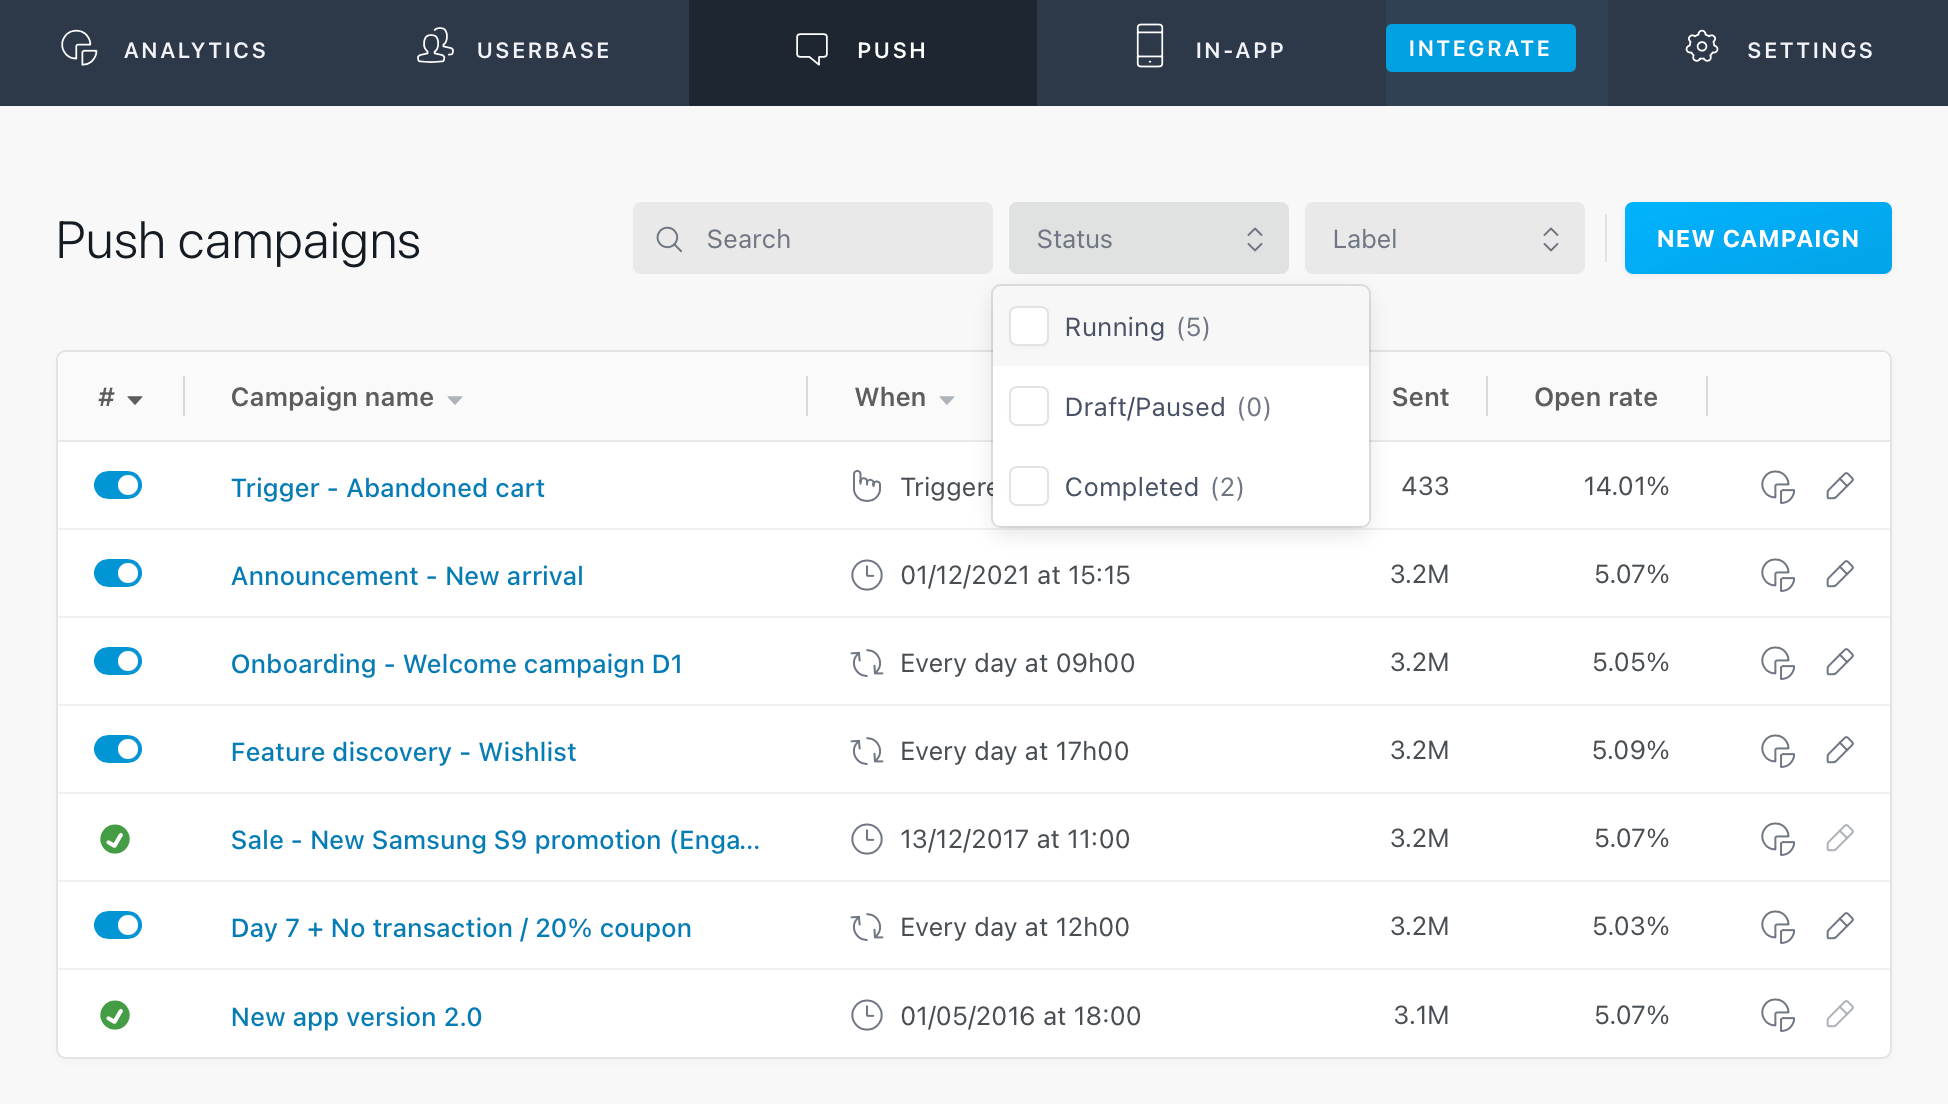
The automations list gives you some basic information on the performance of your In-App automation:
- Trigger: The event that triggers your In-App message.
- Displayed: Total number of unique devices that have already displayed the message.
Automation analytics
Automation analytics exports can be downloaded from the dashboard. The export is in the form of a CSV file containing automations metrics, settings, and much more. It allows you to filter your automations' metrics & data to include in your export. These exports are available from the In-App tab.
For example, you can:
- Analyze In-App automations performance
- Compare automations metrics by label, type, source, country, etc.
- Run in-depth analysis thanks to the extended data exported: sending time, targeting type, message content, etc.
- Etc.
Set your export from the Automations list
First, click on "Filter" and select the status, date range, and labels of automations. Click on "Apply filters" button to save your choices.
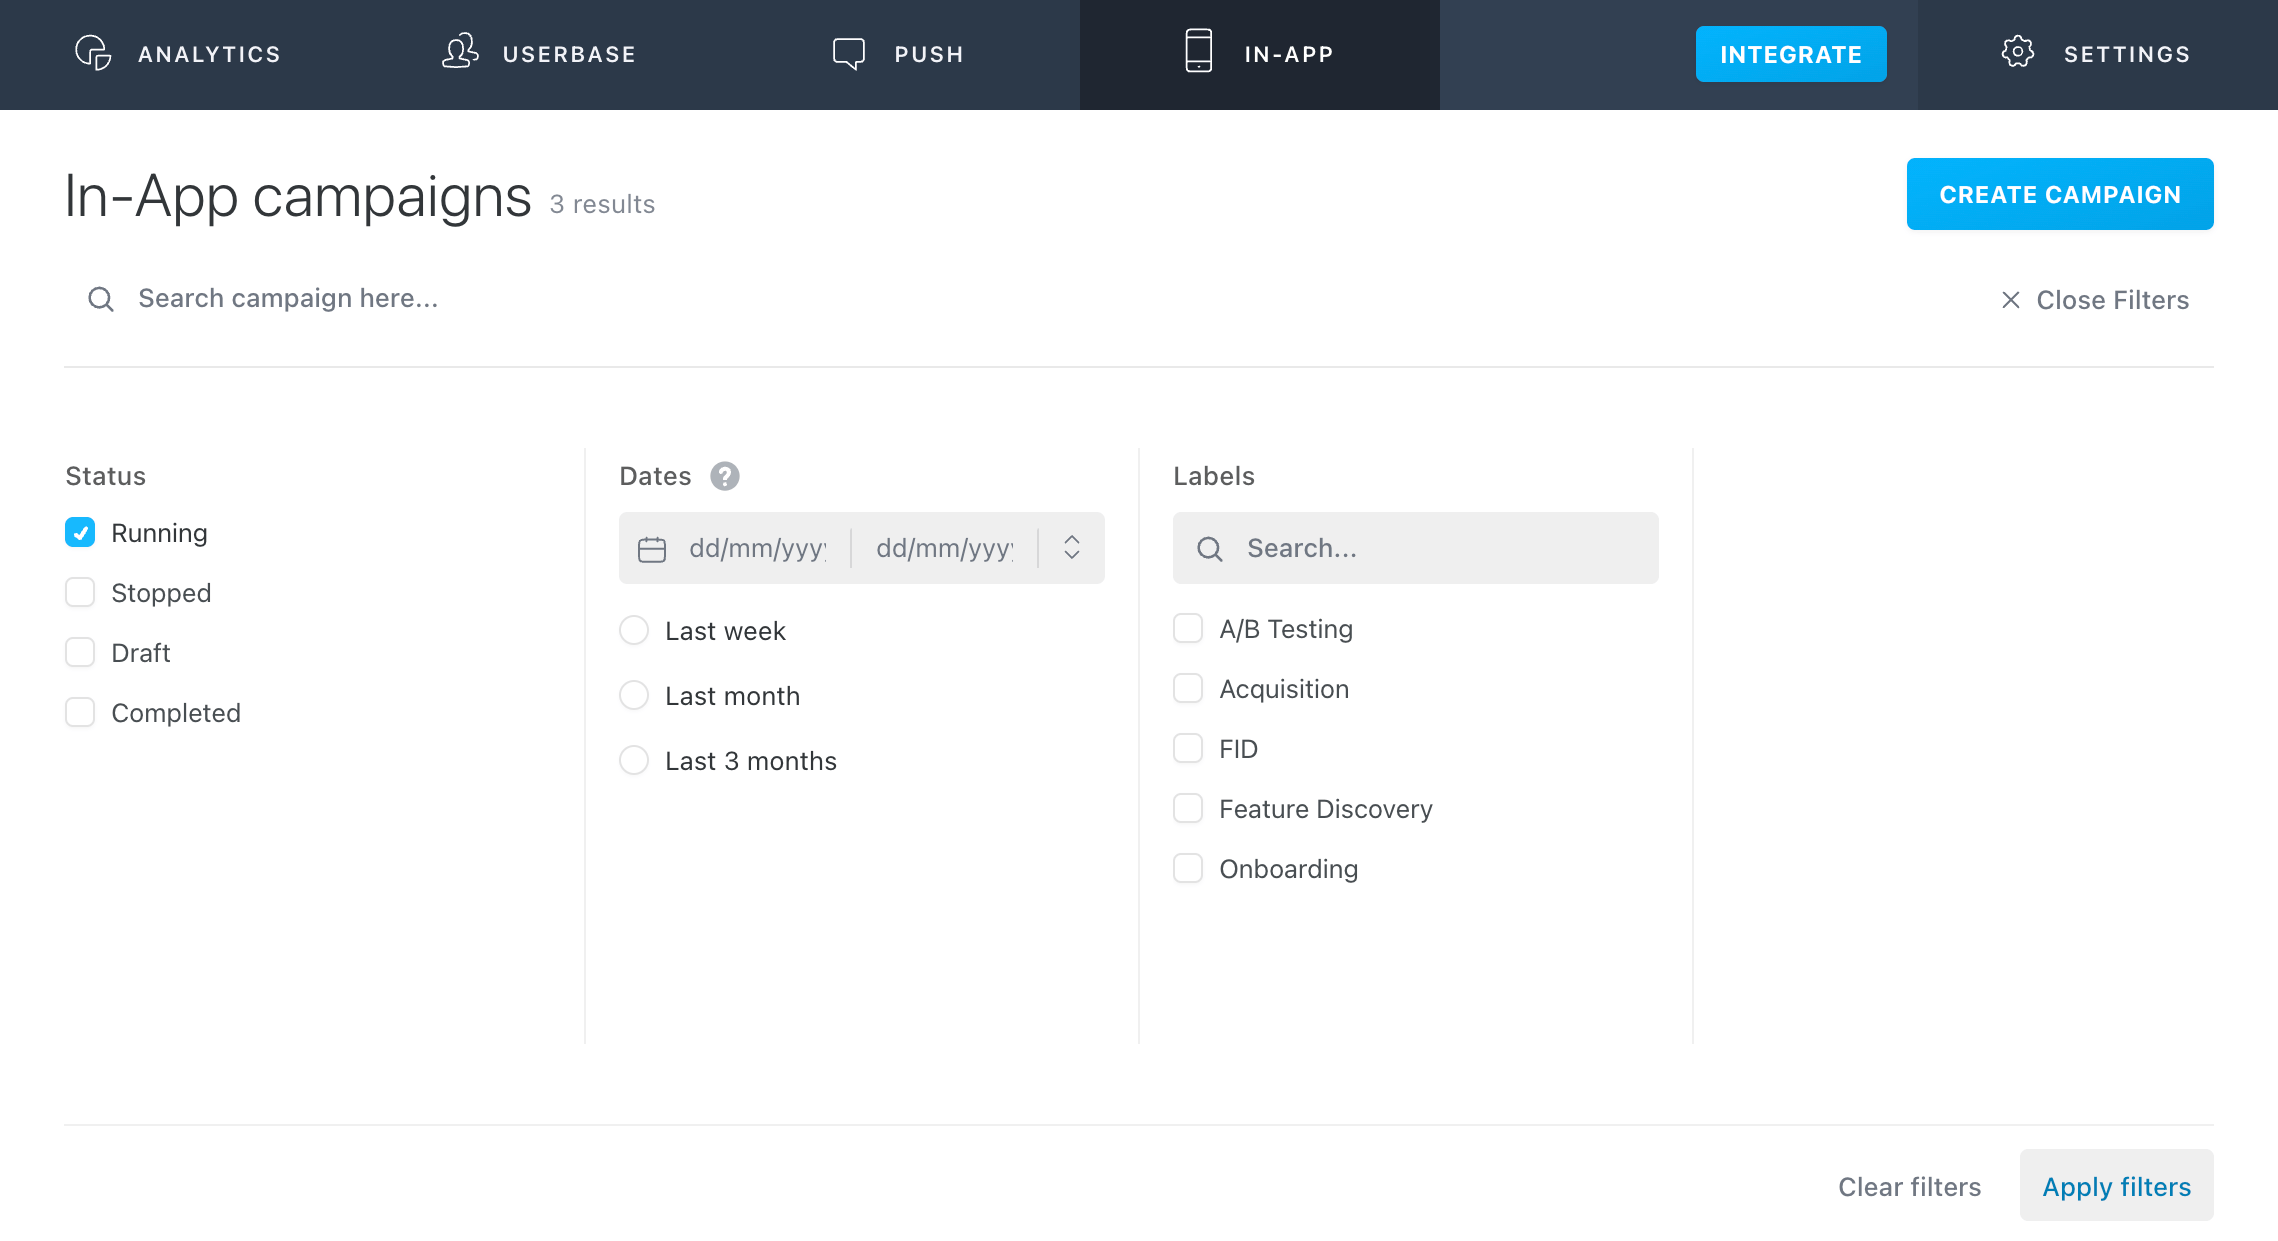
Then, click on "Export" button on top of the last column.
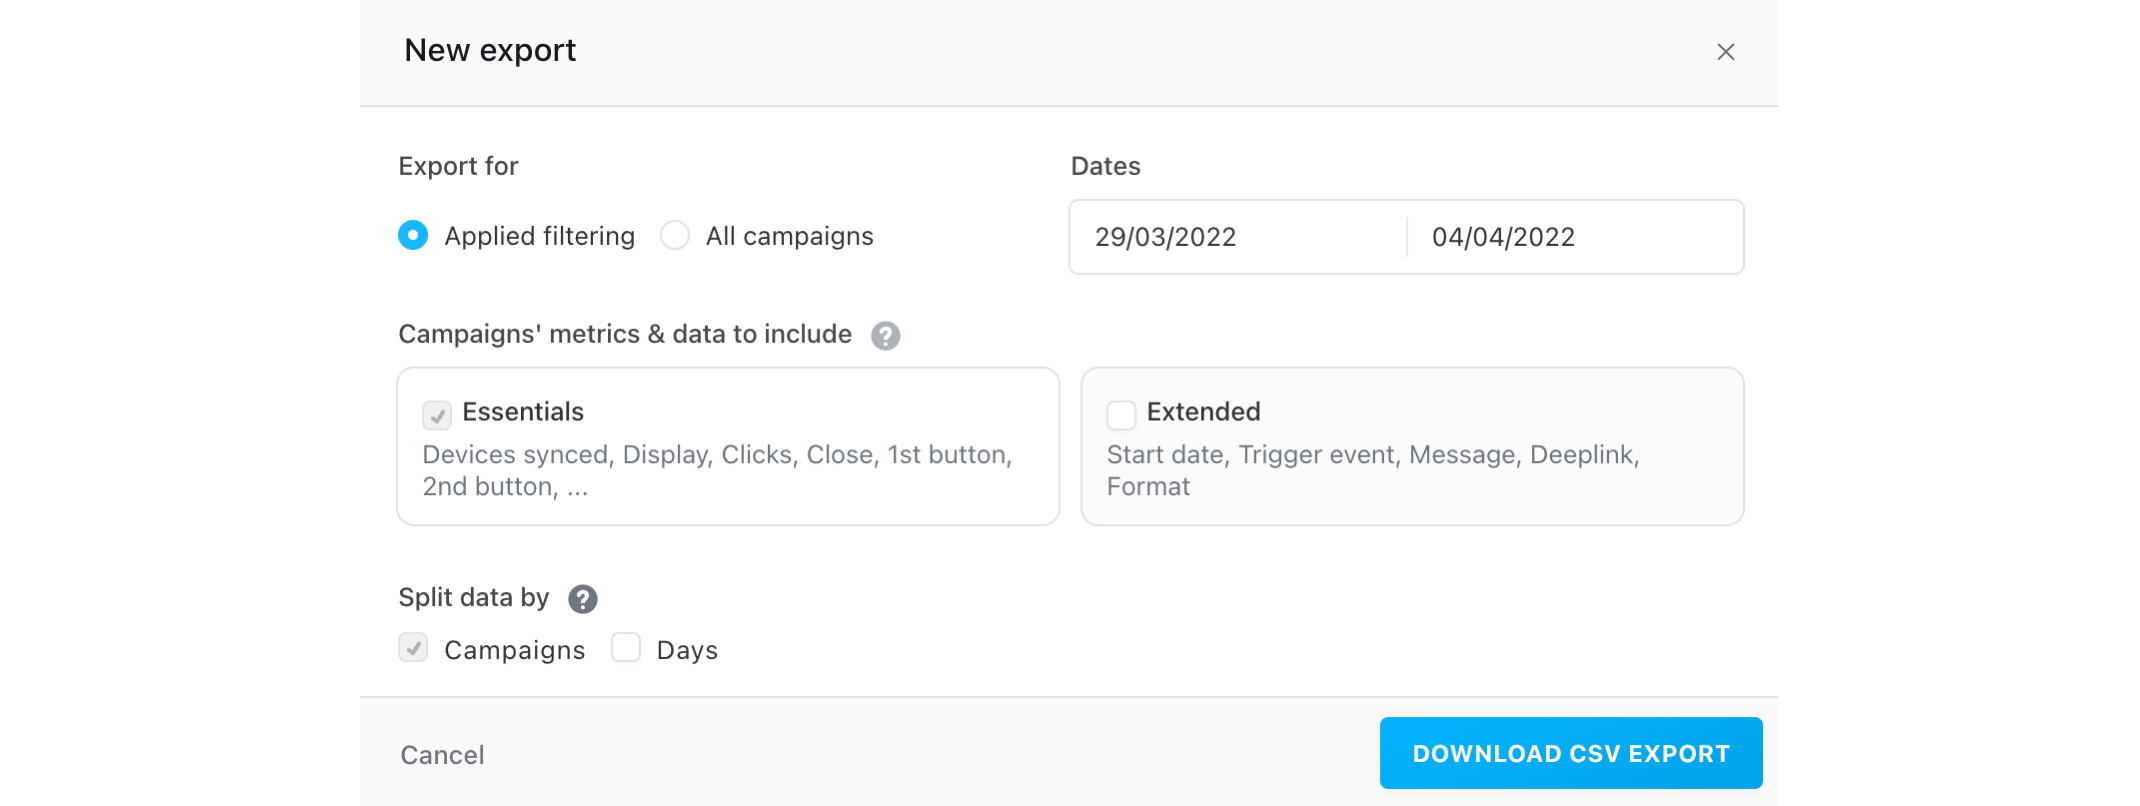
Export filters
Before downloading the CSV Export, you can specify the granularity of your export. By default we are exporting the automations corresponding to the filters you selected. You also have the possibility to export directly the metrics for all your automations by checking "All automations" button.
Automation’s metrics & data
All exports automatically contain essential data by default:
- Essentials metrics represent all the metrics available in your CSV export by default, they are always included. Here is the list of the metrics: token; source; status; label; automation name; device synced; display; clicks; 1st button; 2nd button; close.
In addition to the default export data, you can add additional data:
- Extended data allows you to enrich your CSV export with the following automations setup information: start date (recurring and trigger); end date (recurring and trigger); smart segments; country; custom audience (YES/NO); languages; targeting applied (fullbase or custom targetting); trigger event; message; format; button 1 action; button 2 action; global action; tracking id.
Split data
You can choose the level of granularity of your CSV export. The automation granularty is always selected, you have the possibility to go further in the granularity of your CSV export by choosing to split the data by days.
Advanced analytics

Similarly to push automations, the Analytics button will let you see more detailed statistics about your automation. Let's dive into the details of the available statistics here:
Summary
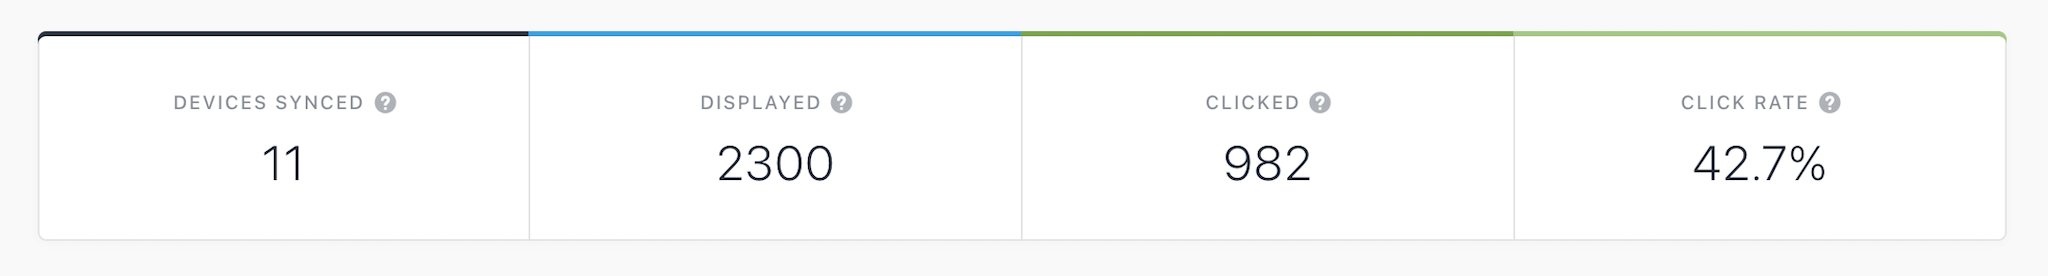
- Devices synced: number of unique devices that were targeted by the automation and have downloaded, or synced the automation locally (see the In-App automation workflow for more information).
- Displayed: number of times the message was displayed.
- Clicked: number of clicks on one of the buttons of the In-App automation. The top-right 'X' close button is not included in this total.
- Click rate: total of clicked messages divided by the total of displayed messages.
Performance
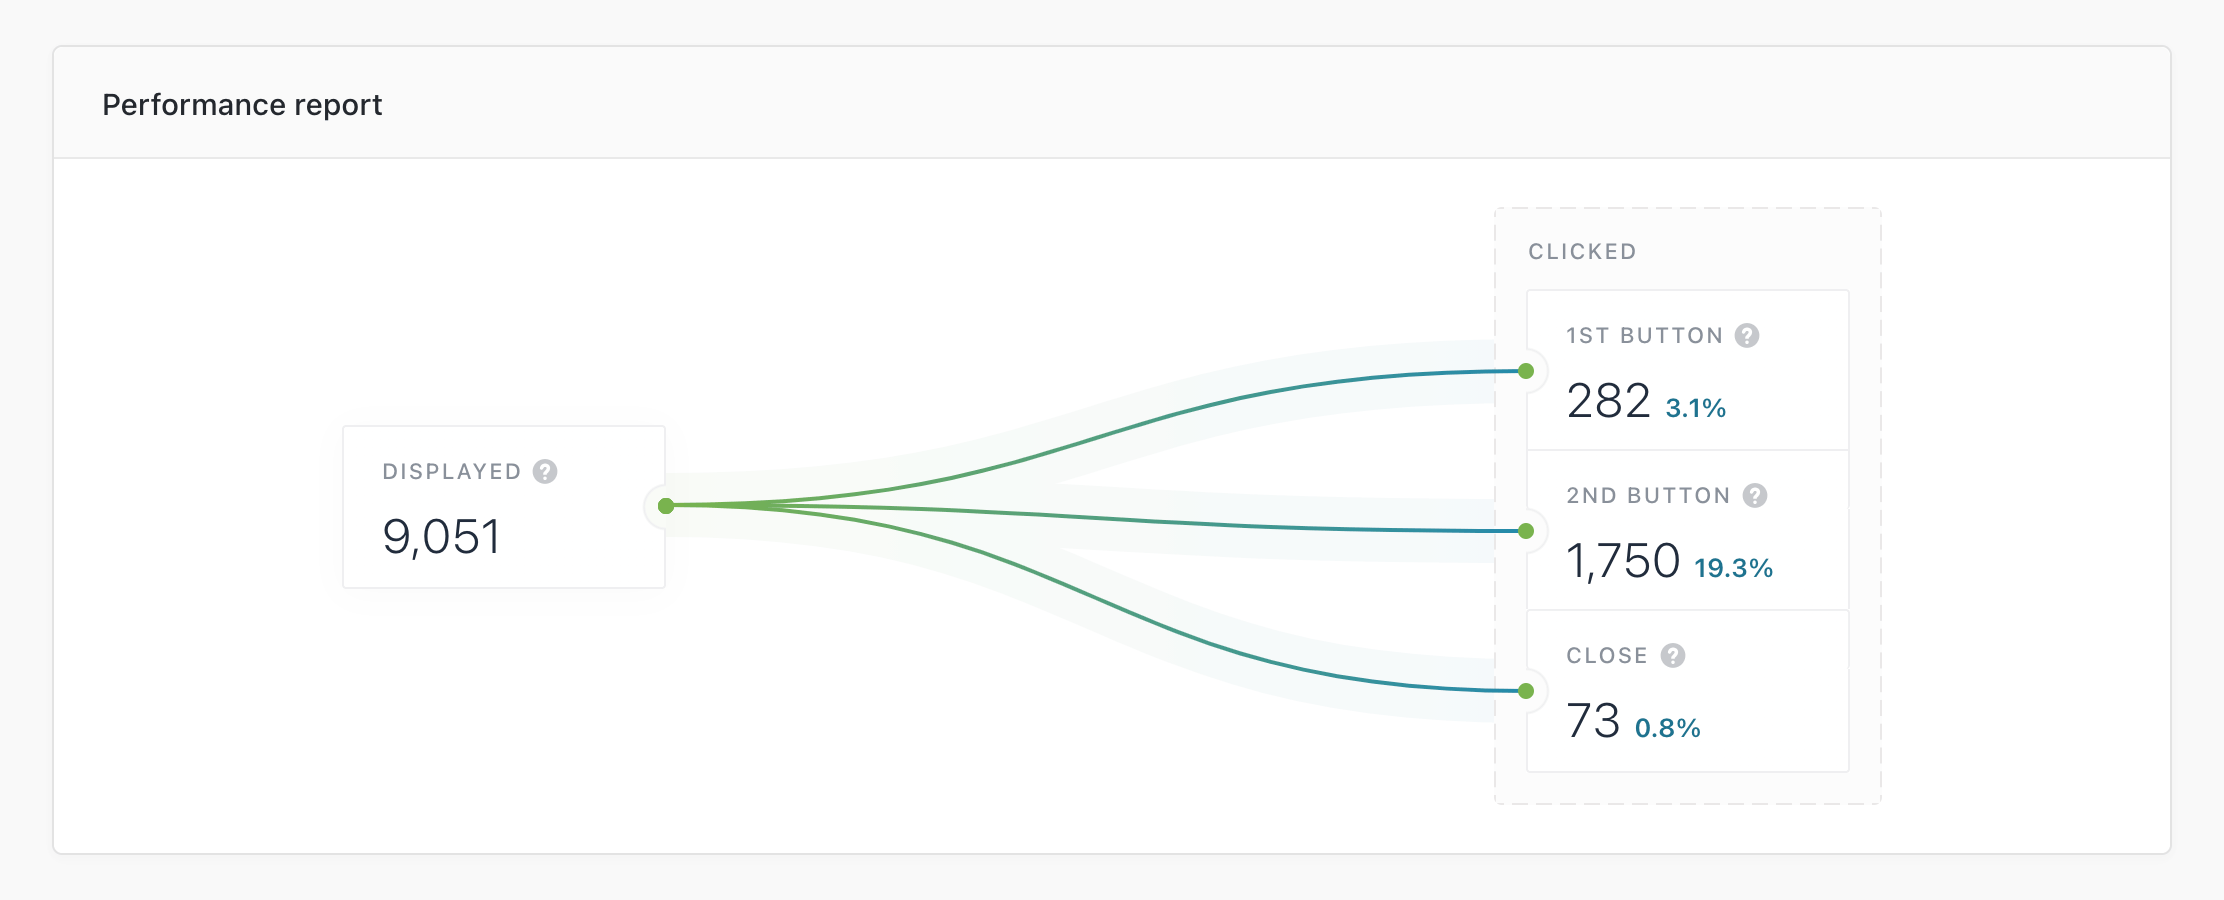
The performance section will run you through the results of your automation, from the number of displayed messages to click distribution.
- Displayed: Number of times the message was displayed.
- Clicked 1st/2nd button: Number of clicks on the message's buttons. Hover over the tooltips to read the content of the buttons in your message. (Fullscreen, Banner and Modal formats only)
- Close: Number of clicks on the native close button.
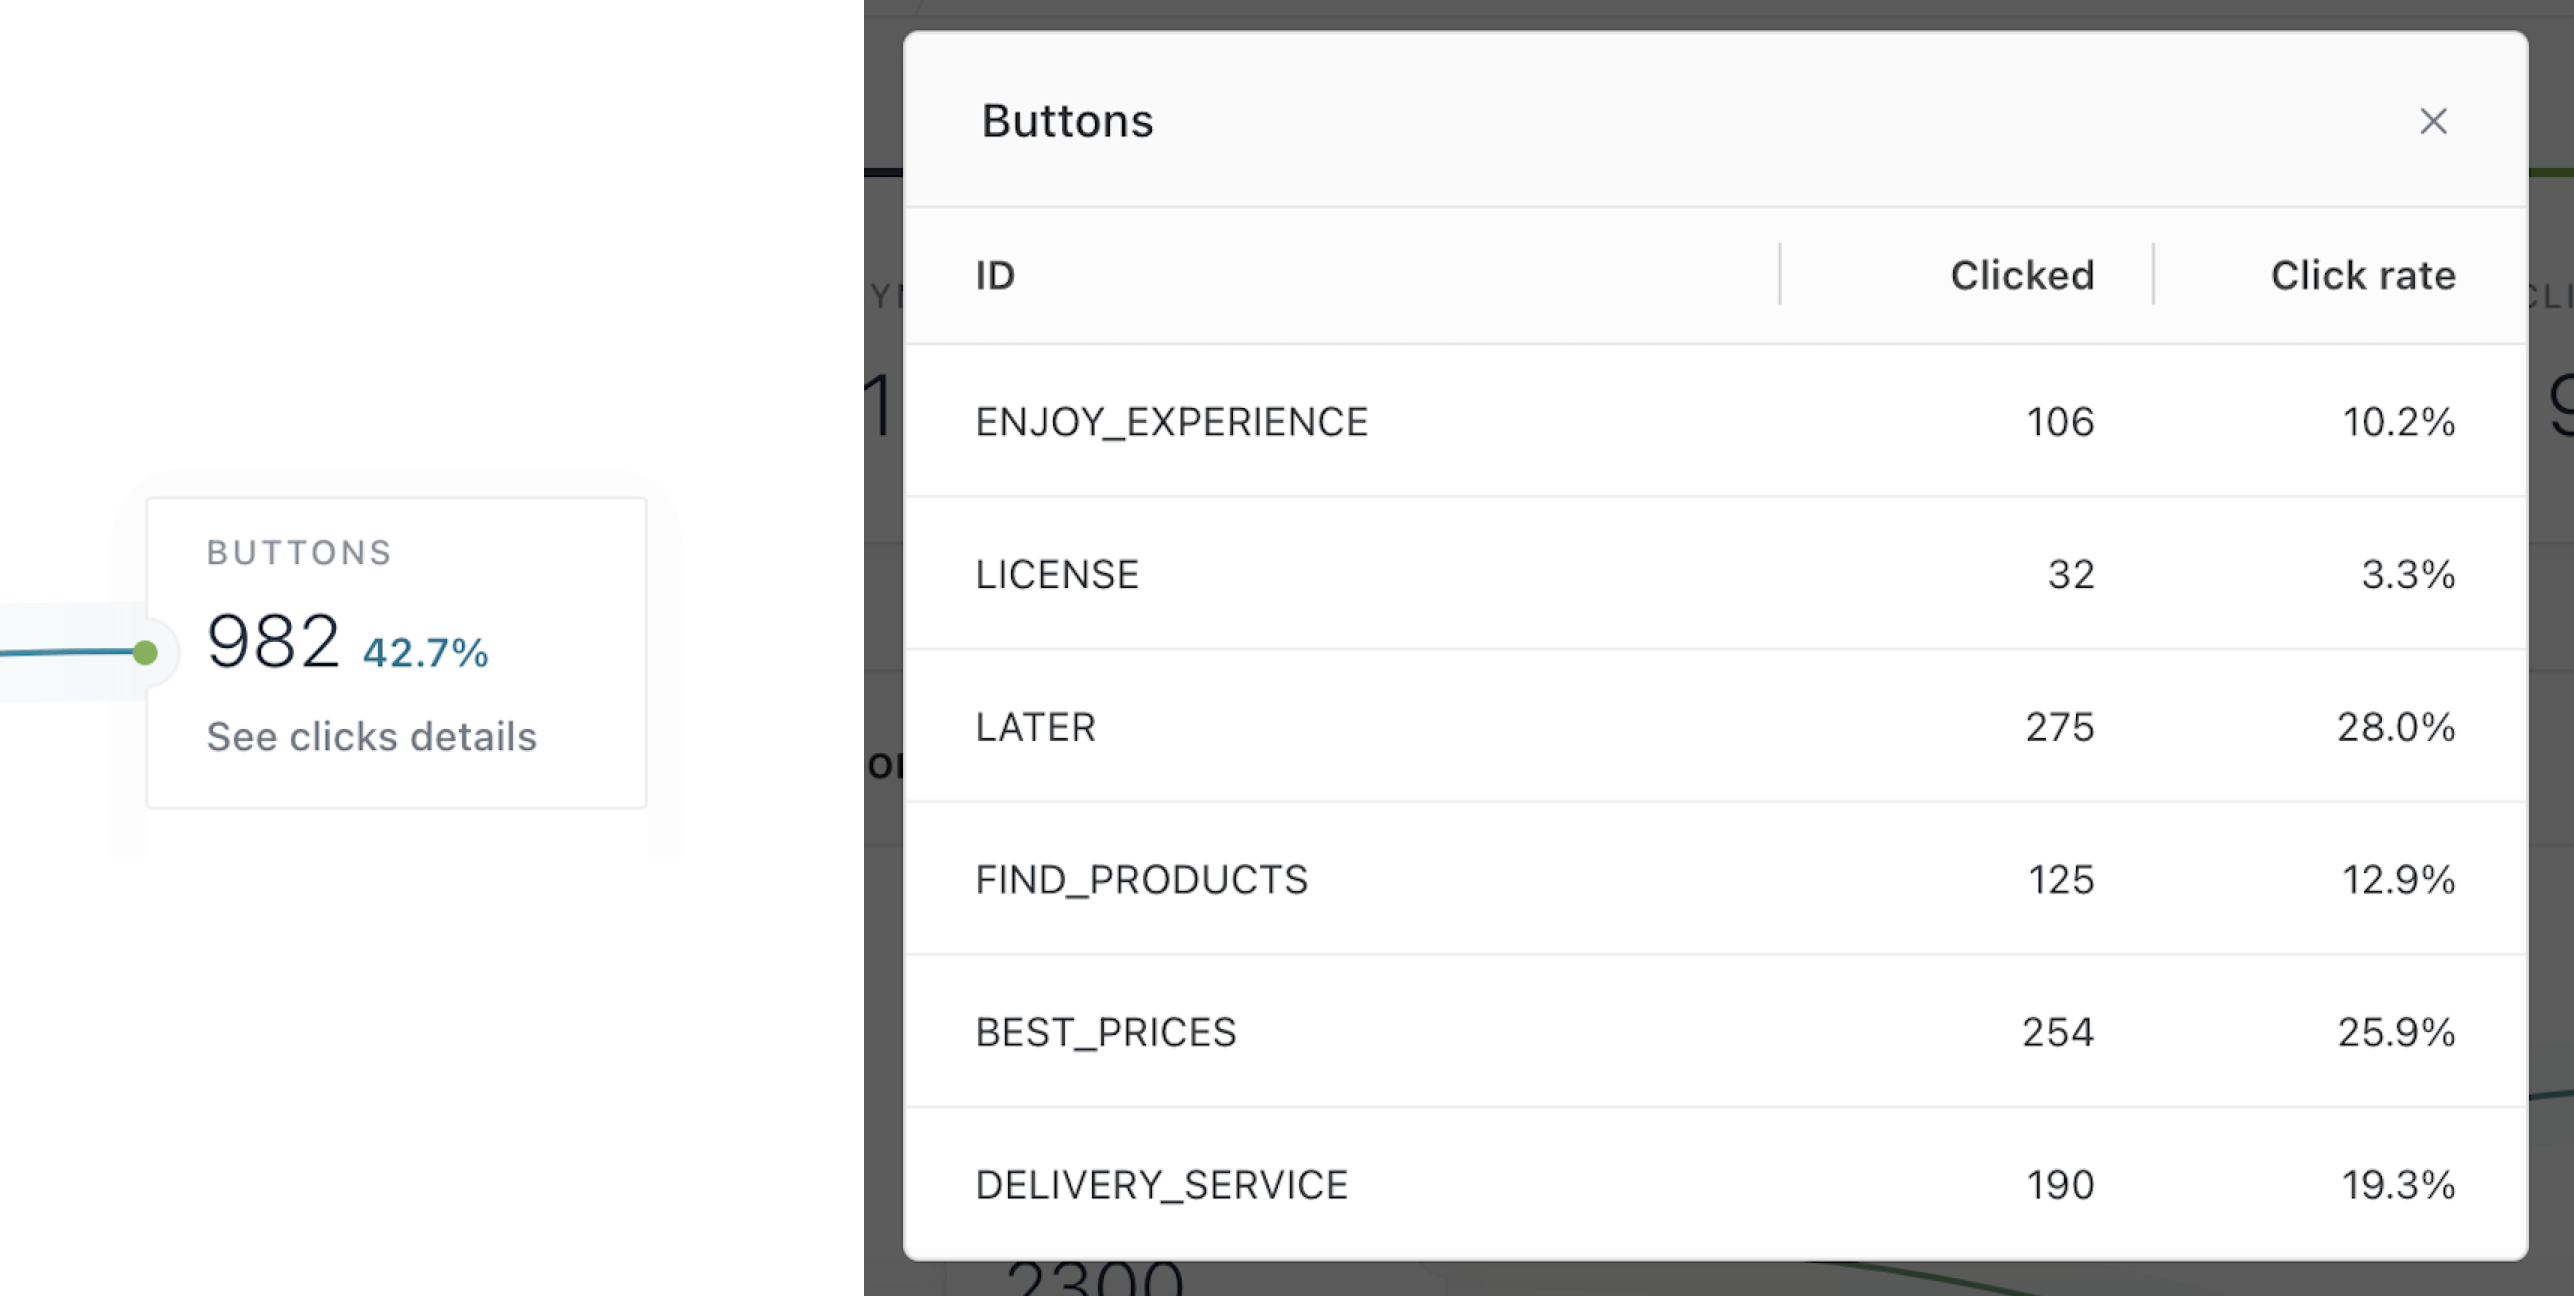
- Buttons: WebView format only - Total number of clicks on the message’s buttons. Click “See clicks details” to get the clicks and click rate per button ("Analytic identifiers"):
Daily statistics
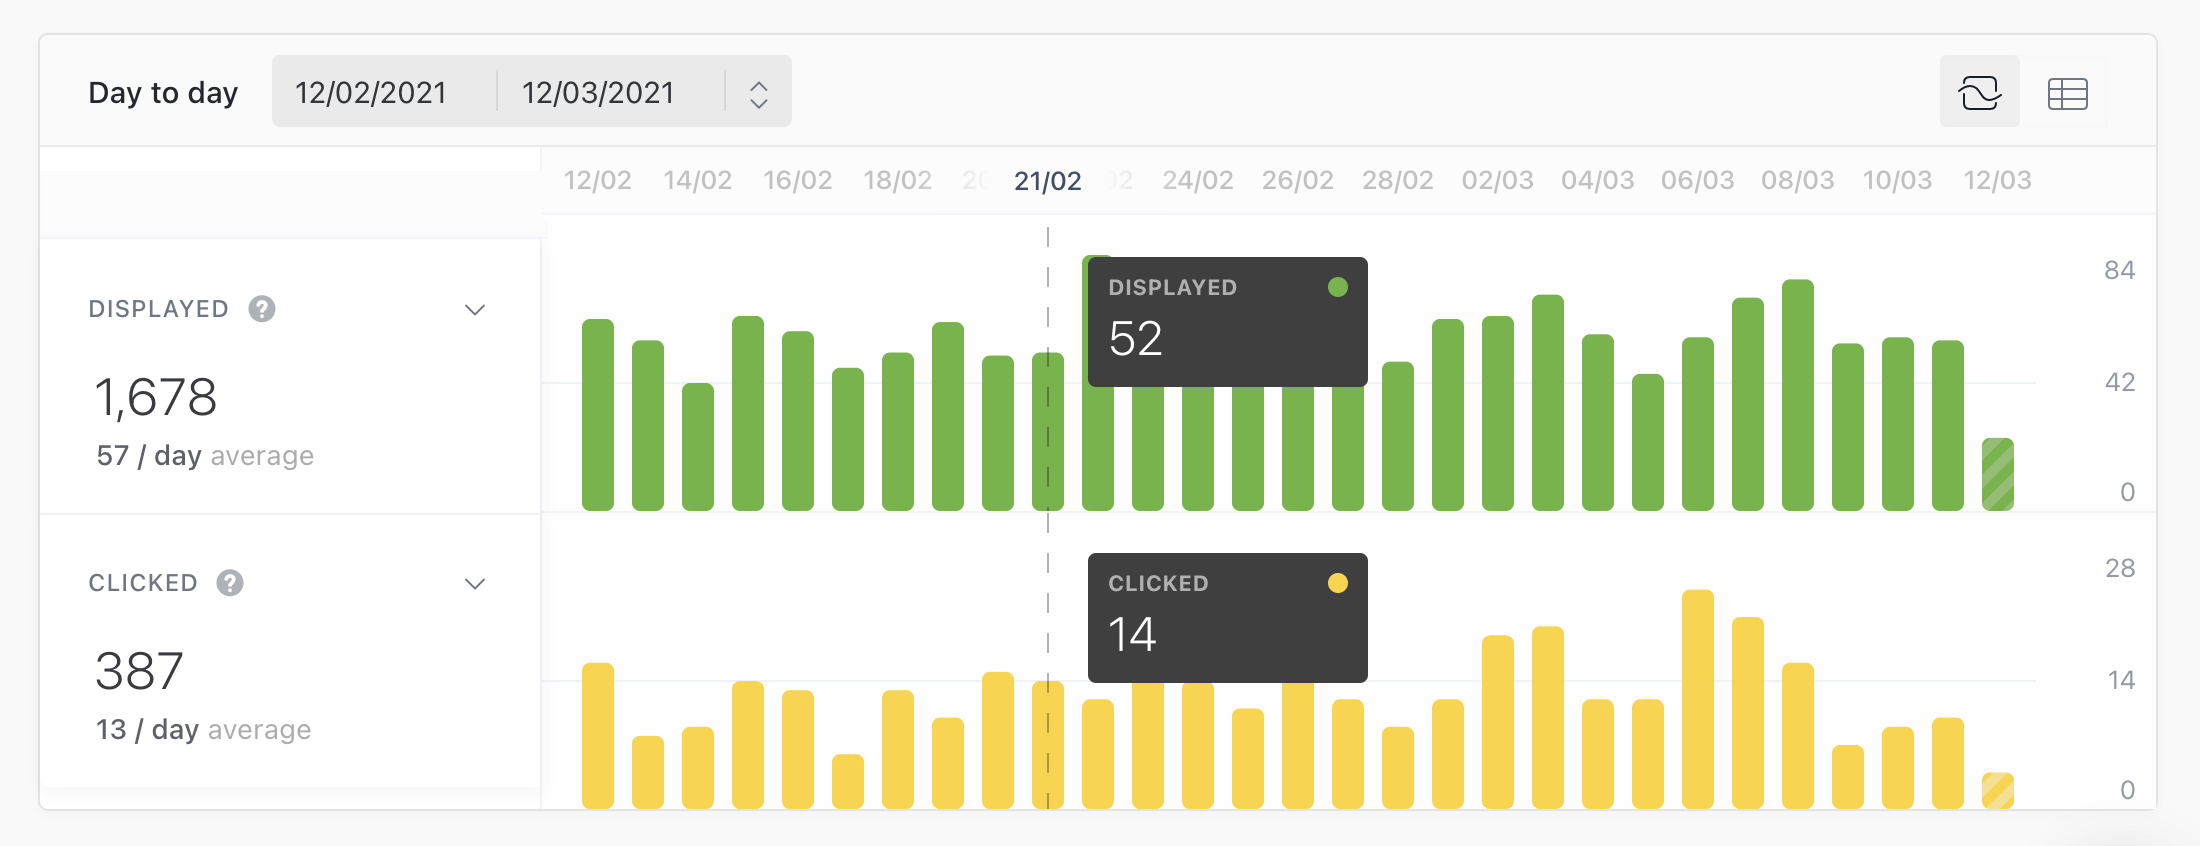
The histogram view allows you to compare visually two metrics of your choice on a given time range. You can also choose the array view to see all the metrics at once:
- Displayed: Number of times the message was displayed.
- Clicked: Number of clicks on one of the message's button.
- 1st / 2nd button: Number of clicks on the 1st / 2d button of the In-App message.